By
Michael McGaughy, East Bridge Advisors
SAN FRANCISCO (KWR) -- August 4, 2005 -- Perhaps the
simplest and most direct exposure US investors
can have to China’s equity markets is the
iShares FTSE/Xinhua China 25 Index Fund (NYSE:
FXI). The fund tracks the performance of the
similarly named FTSE/Xinhua China 25 Index, and
provides exposure to the largest and most liquid
Mainland China stocks available to non-PRC citizens.
All companies’ have their primary or secondary
listing in Hong Kong and 17 also have US listed
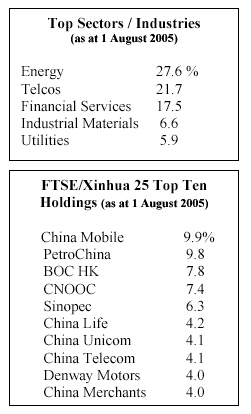
ADRs. The top ten companies account for 61% of
the index.
The fund’s annual management fee is 0.74%. This
is less than the 2% or higher fees for alternatives,
such as actively managed Emerging Markets, Asian and
Greater China funds, which typically provide less direct
exposure to the Mainland. Additionally there are no 12b-1
fees or other associated expenses beside brokerage.
The fund is managed by Barclays Global Investors, the
world’s largest manager of ETFs. It was launched
in October 2004 and presently has over US$900m in assets.
Liquidity is good with an average daily trading volume
of over US$8m. Put and call options are available. The
index is reviewed and rebalanced quarterly to keep constituent
companies below 10% of overall net asset value. For instance
at the end of July, the fund’s holding of China
Mobile decreased to 9.9% of the fund’s net assets
from 10.9%.
Dividends of the underlying companies flow through to
the fund’s shareholders and are paid once per year
(2005 ex-date is 23 December). The fund has not paid
any dividends since being listed, which according to
iShares professionals, is due to the newness of the fund.
Recent performance has been good with the fund's price
hitting new highs since its October 2002 launch. Most
of index’s
constituents are trading closer to their 52-week highs
than their 52-week lows.
The index and fund provide good exposure to the Mainland,
with virtually all companies’ earnings directly
tied to China’s economic growth and most companies
will be net beneficiaries of any further Rmb appreciation.
One standout, BOC HK is the Hong Kong subsidiary of one
of the Mainland’s largest banks, Bank of China,
and does virtually all its business in Hong Kong despite
its name. Other companies with significant non-China
operations include China Resources with 49% of sales
from outside the Mainland, and Citic-Pacific with 41%
of its turnover coming from HK.
The fund also provides good exposure to sectors that
most institutions typically look at to invest in a country’s
overall growth – energy (28% of the fund), Telcos
(22%) financial services (18%), industrial materials
(7%) and utilities (6%).
Valuation
 The index appears to be inexpensive compared to interest rates. Based on sell-side
analysts’ EPS forecasts and August 1 prices, the fund’s constituent
stocks are trading at a weighted average P/E of 12.8x 2005 earnings. This equates
to an earnings yield of 7.8%, about 300 bp more than the 4.78% yield on the US$
China BBB+ bond.
The index appears to be inexpensive compared to interest rates. Based on sell-side
analysts’ EPS forecasts and August 1 prices, the fund’s constituent
stocks are trading at a weighted average P/E of 12.8x 2005 earnings. This equates
to an earnings yield of 7.8%, about 300 bp more than the 4.78% yield on the US$
China BBB+ bond.
Earnings growth is expected to be modest. Weighted average EPS is expected to
increase by 8.8% in 2005 and 5.3% in 2006. The decrease in growth is in line
with the forecasted slowing of the Chinese economy in 2006.
Dividend yield is attractive compared to local HK based deposit rates. Based
on the sell-side’s DPS forecasts (1), the fund’s constituent stocks
are expected to produce a weighted average dividend yield of 3.3% in 2005 and
3.5%
in 2006. While not as much as US$ deposits in the US, it is significantly higher
then interest rates on US$10,000 equivalent 6-month Rmb, HK$ and US$ money market
deposits in Hong Kong of 0.70%, 1.60%, and 1.10% respectively.
The market is expecting a hefty increase in dividends, but is pricing in decreasing
cash flow. Applying a simple dividend discount model to all constituent companies,
at an assumed 12% discount rate, the market is pricing in a perpetual dividend
growth of 8.3%. On a discounted cash flow basis, and an assumed WACC of 12% the
market is pricing in a perpetual cash flow decrease of 3.9%.
The last point is particularly interesting as analysts are forecasting that weighted
average cash flow per share will increase by 14% in 2005 and 7% in 2006, and
that weighted average cash flow yield is expected to increase to 15.2% in 2006
from last year’s 12.9%.
Another significant point is that the sell-side is expecting the fund’s
underlying companies’ weighted average payout ratio to increase to 40.1%
in 2006 from 38.5% last year. Increasing payout ratios tend to be double signaling
events implying a higher long-term level of expected earnings and improved corporate
governance, as evidenced by managements’ willingness to return cash to
shareholders. This is consistent with China’s long-term movement toward
allowing state owned companies to operate as on-going commercial concerns. With
average state ownership at about 65% or more for China’s listed companies,
high dividend payouts also provide their state-owned parents with steady cash
flow.
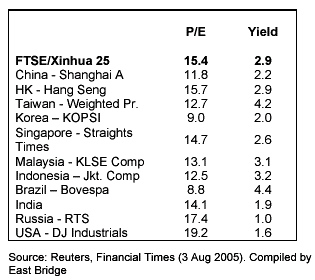 On a P/E basis, at 15.4x 2004 earnings the valuation of the fund’s constituent
stocks is higher than other commonly quoted regional and emerging markets indexes.
It is dearer than the main indexes used to track the markets in Shanghai, Taiwan,
Korea, India and Brazil, but less expensive than Russia and the US and in line
with Hong Kong.
On a P/E basis, at 15.4x 2004 earnings the valuation of the fund’s constituent
stocks is higher than other commonly quoted regional and emerging markets indexes.
It is dearer than the main indexes used to track the markets in Shanghai, Taiwan,
Korea, India and Brazil, but less expensive than Russia and the US and in line
with Hong Kong.
Dividend yield is arguably a better valuation measure due to different regional
and corporate reporting and policies that make cross border earnings, and hence
P/E ratios, difficult to compare. On a historic yield the FTSE/Xinhua’s
constituent stocks are in the mid-range of several widely quoted emerging markets.
It has a higher historic yield than Korea, Singapore, and India, but less than
Taiwan and Brazil. Based on current prices, its yield was largely in line with
the Shanghai A-Share market, Hong Kong, and Malaysia.
Disclosure: The author of this article owns shares in the iShares FTSE/Xinhua
China 25 Index Fund.
(1) All
FTSE/Xinhua constituent companies are actively followed
by institutional analysts, mostly based in Hong Kong,
with some based in Shanghai. Earnings estimates and dividend
forecasts used as a basis for this article are for 2005
and 2006 and come from Reuters compiled data using Hong
Kong GAAP based estimates.
This
investment profile is not intended
as investment advice or as an offer
or solicitation with respect to the
purchase or sale of this or any other
security. While the information contained
within is believed to be accurate,
it should not be construed as offering
a guarantee as to the accuracy or completeness
of the information contained herein
and should be checked independently
by the reader before it is used to
make any business or investment decision.
All opinions and estimates included
are subject to change without notice
and the author as well as KWR International,
Inc. staff, consultants and other newsletter
contributors to the KWR International
may or may not have a long or short
position in any security or option
mentioned within this article or any
other information published by KWR
International, Inc.


![[ Clients ]](../../../clients/aha.gif)